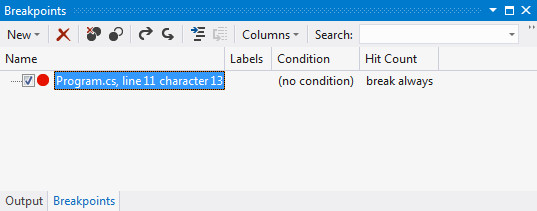
When you create a breakpoint in Visual Studio 2012, you have certain options available that determine exactly when the debugger breaks and what happens when it does. These options are available via the Breakpoints window (Debug -> Windows -> Breakpoints, or Alt+F9)...
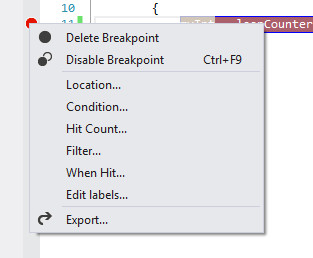
...or by right-clicking the breakpoint:
I'll go through the first few of these menu options and describe its use.
Delete Breakpoint
No surprises here; selecting this menu item has the same effect as hitting F9. It deletes the breakpoint.
Disable Breakpoint
This option disables the breakpoint, so Visual Studio won't break at this breakpoint until it is enabled.
Location...
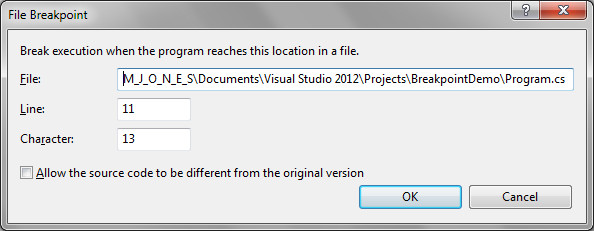
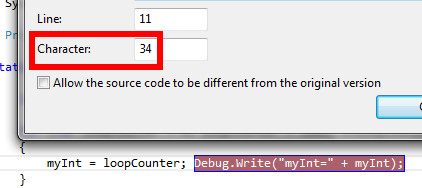
This shows a window that allows the code location of the breakpoint to be edited:
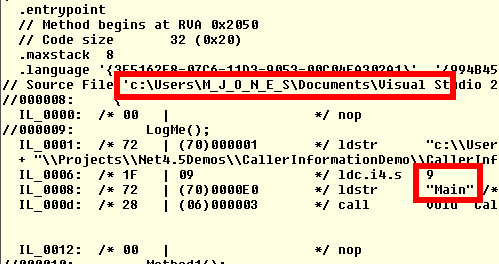
This is useful if e.g. you have multiple code statements on the same line; it allows you to set a breakpoint on a specific statement, by selecting the character position of a character in the required statement (note, this can also be achieved by selecting the statement and hitting F9) :
The screen gives the option to
Allow the source code to be different from the original version. When this option is selected, if the source file of a debugged library has changed from the version referenced, the debugger will still allow the referenced version to be debugged.
Condition...
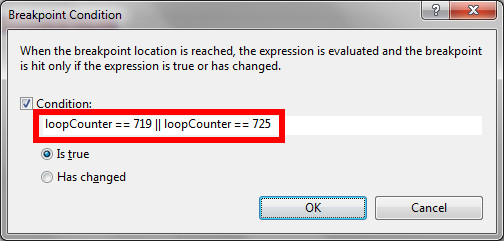
This shows a window that allows you to change the condition that must be satisfied before the debugger stops the code at the breakpoint:
The condition can be set to
Is true, i.e. when the condition is met, or
Has changed, i.e. when the specified variable or expression evaluates to a new value.
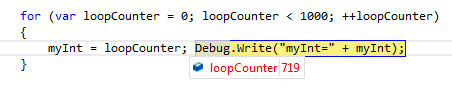
The example above sets the breakpoint to break when the variable
loopCounter is equal to 719 0r 725:
Hit Count...
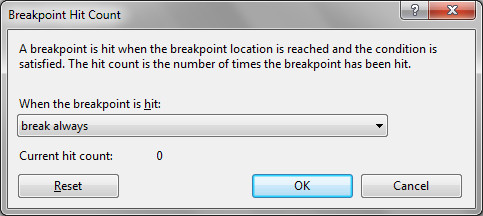
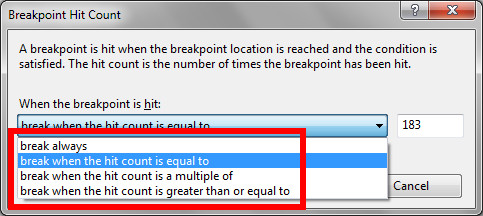
This shows a window that allow you to specify the number of times the breakpoint needs to be hit before the debugger breaks:
The default for a breakpoint is for it to break every time the statement is reached. Other options allow you to specify a numeric value that is used to calculate whether the debugger should break:
This example causes the debugger to break when the statement has been hit 183 times:
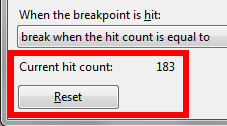
While the debugger is paused at the breakpoint, opening the Hit Count window shows the current hit count, and allows you to reset it so that the count starts again from zero.